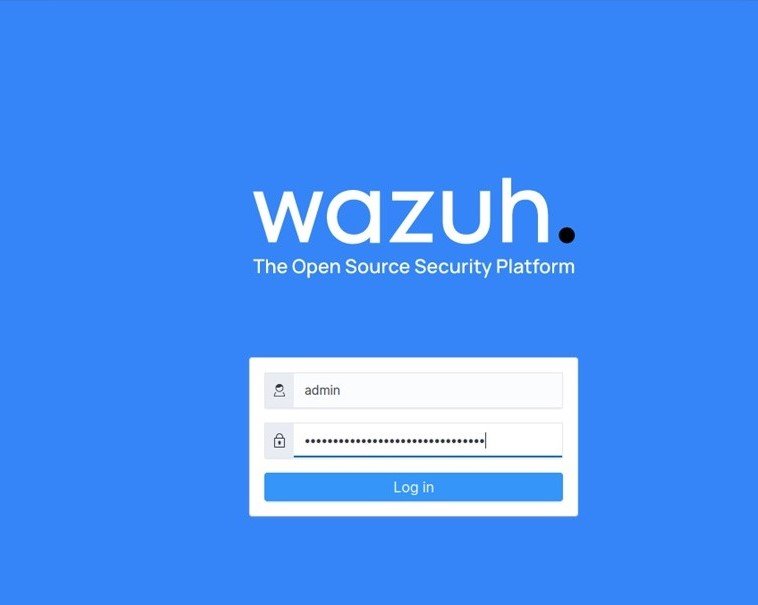
Wazuh is a free, open-source security information and event management (SIEM) platform designed to help organizations monitor and analyze security events occurring across their IT infrastructure. Its architecture is composed of several key components working together to provide comprehensive security monitoring and threat detection capabilities.
Here’s an overview of the main components and architecture of Wazuh:
Agents:
Agents are lightweight software components installed on endpoints (servers, workstations, etc.) that need to be monitored.
They are responsible for collecting various types of data, including system logs, file integrity information, process accounting data, registry entries (on Windows), and more.
Agents perform local analysis on the collected data using predefined rules and configurations to detect security incidents or anomalies.
They communicate securely with the Wazuh manager to send collected data and receive instructions or configurations.
Manager:
The manager is the central component of the Wazuh architecture responsible for coordinating the agents and processing security data.
It receives data from agents, performs normalization to ensure consistent data formats, and stores the information in a database.
The manager contains the ruleset, which defines conditions for detecting security threats based on observed events or patterns.
It correlates events from multiple sources to identify complex attack scenarios or suspicious behavior.
The manager generates alerts based on detected security incidents and sends notifications to administrators or other systems for further action.
It provides a web-based user interface (Wazuh app) for administrators to monitor security events, manage configurations, and investigate incidents.
API:
The API (Application Programming Interface) allows external systems or applications to interact with the Wazuh manager programmatically.
It provides a set of endpoints for querying security data, managing configurations, retrieving alerts, and performing administrative tasks.
The API enables integration with other security tools, custom applications, or orchestration platforms for automation and workflow integration.
Elastic Stack Integration:
Wazuh integrates with the Elastic Stack (Elasticsearch, Logstash, and Kibana) to enhance its capabilities in log management, data visualization, and advanced analytics.
Elasticsearch is used as the backend for storing and indexing security data, enabling fast and scalable search capabilities.
Logstash is employed for data collection, parsing, and enrichment before storing the data in Elasticsearch.
Kibana provides a graphical interface for visualizing security data, creating dashboards, and conducting detailed analysis.
Ruleset:
The ruleset defines detection logic and policies used by agents and the manager to identify security threats.
It consists of a collection of rules written in a specific format that specifies conditions for triggering alerts based on observed events, behaviors, or patterns.
The ruleset covers various types of security threats, including malware infections, unauthorized access attempts, system misconfigurations, and more.
Administrators can customize the ruleset to tailor it to the specific security requirements and operational needs of their organization.
These components work together to provide comprehensive security monitoring, threat detection, and incident response capabilities, helping organizations protect their IT infrastructure from a wide range of security threats.
Wazuh dashboard
The Wazuh dashboard is a central component of the Wazuh architecture, providing administrators with a graphical interface to monitor security events, manage configurations, and investigate incidents. Here’s an explanation of its key features and functionalities:
User Interface:
The dashboard offers a user-friendly interface accessible via a web browser.
It provides various views and panels to display important security information, including alerts, system status, and trends.
Alerts Panel:
The alerts panel presents a list of security alerts generated by the Wazuh manager based on detected security incidents or anomalies.
Each alert includes details such as the severity level, description, timestamp, affected host, and relevant context.
Administrators can filter and search alerts based on different criteria to quickly identify and prioritize security events.
Visualization:
The dashboard offers various visualization tools and widgets to represent security data graphically.
Charts, graphs, and tables help administrators visualize trends, patterns, and correlations in security events over time.
Visualization widgets may include histograms, pie charts, line charts, and geographical maps, providing different perspectives on security information.
Customizable Dashboards:
Administrators can customize the dashboard layout and content to suit their specific monitoring needs and preferences.
They can create multiple dashboards tailored to different use cases, such as network security, endpoint monitoring, compliance monitoring, etc.
Customization options may include adding or removing panels, resizing panels, rearranging panels, and configuring widget settings.
Real-Time Monitoring:
The dashboard provides real-time monitoring capabilities, continuously updating to reflect the latest security events and alerts.
Administrators can configure refresh intervals to control how frequently the dashboard updates with new data.
Real-time monitoring enables rapid detection and response to security incidents as they occur, helping minimize the impact of potential threats.
Search and Filtering:
The dashboard includes search and filtering functionality to facilitate navigation and data exploration.
Administrators can search for specific security events, hosts, or attributes using keywords or predefined filters.
Advanced filtering options allow administrators to refine search results based on various criteria such as severity, source IP, destination IP, event type, etc.
Integration with Other Tools:
The dashboard may support integration with external tools or systems, enabling seamless collaboration and workflow automation.
Integration with ticketing systems, incident response platforms, or threat intelligence feeds enhances the effectiveness of security operations and incident response.
Overall, the Wazuh dashboard serves as a central hub for security monitoring and management, empowering administrators to effectively monitor their IT infrastructure, detect security threats, and respond to incidents in a timely manner. Its intuitive interface and rich visualization capabilities make it an essential tool for maintaining the security posture of organizations of all sizes.
To Explore More in DevSecOps- Read More :
Roles and Responsibilities of DevSecOps Engineer
DevSecOps Tool-Static Application Security Testing (SAST) tools
DevSecOps Tool-Dynamic Application Security Testing (DAST) Tools
DevSecOps Tool-Software Composition Analysis (SCA) Tools
DevSecOps Tool-Container Security Tools in DevSecOps
DevSecOps Tool-Infrastructure as Code (IaC) security Tools
DevSecOps Tools – Secrets Management Tools
DevSecOps Tools – Vulnerability Management Tools
DevSecOps Tools – Security Orchestration, Automation, and Response (SOAR) Tools
DevSecOps Tools – Security Information and Event Management (SIEM) tools


